Performance Statistics Display
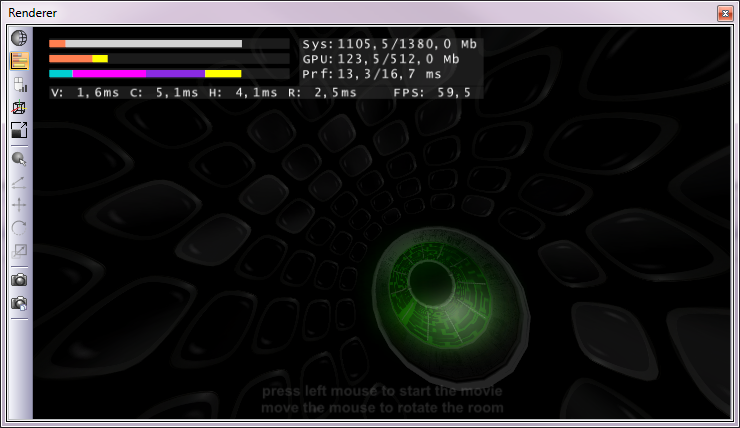
The Performance Statistics in the upper left corner of the Renderer window display information about the memory usage of the entire Ventuz process (all loaded scenes and resources) and the validation and rendering time of the active scene.
The display consists of three colored bars and the appropriate text labels.
The topmost bar Sys represents the usage of system memory for the Ventuz process. This bar can consist of two parts, an orange and light gray bar. The orange bar displays the memory usage for swappable DirectX resources (DirectX calls them Managed Resources). These resources may currently be stored in the video memory of the graphics card but a copy always exists in the system memory. If such a resource was not rendered for a long time it may be removed from the graphic card memory and only exist in the system memory. The light gray bar represents the system memory which is used by a Ventuz process but is not reserved by DirectX resources. The values right to the bar displays the currently used memory and the maximum available system memory for this process in Megabytes.
The middle bar GPU displays the graphics memory usage. Dependent on the used resources in the scene it can consist of two parts. The orange part represents the swappable resource memory as described above. The yellow part represents the memory usage of fixed resources (DirectX calls them Default resources). These are resources which only exist in the graphics memory and stay there until they are removed whether they are used or not. E.g. Rendertargets and Movie Clip nodes, which need fixed graphics memory. Note that swappable memory value represents the worst case because it is not possible to determine if a swappable resource is currently located in the graphics memory or not. This means that your overall graphics memory usage may exceed the available memory on your graphics card.
The lowest bar Prf displays the times needed for scene validation and rendering and thus gives you information about the performance of the scene. This bar consists of four segments. The turquoise segment represents the time per frame needed for the video frame transfer of all running movies/live videos in the active scene (the V-value). This does not apply to Quicktime movies as the decoding is done in the following node validation. The magenta bar segment corresponds to the time needed for validation of nodes (mostly the Content nodes) which have been invalidated through bound property values (the C-value). The time needed to traverse and validate the Hierarchy tree is represented in the violet segment (the H-value). The yellow segment represents the time needed by the graphics card to render the scene (the R-value). The values right to the bar display the sum of all four values and the available time per frame (depends on refresh rate) in milliseconds. The text line below displays the four performance values and the current frame rate. These are average values which are updated every second.

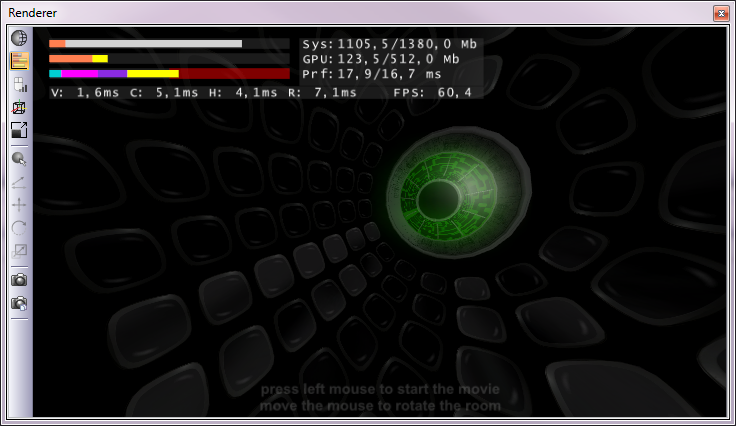
If any of the statistics bars exceeds the maximum value, the display changes. The bar is scaled by 0.5 and the other half is filled with a red ‘critical’ section (see image below). If any bar value even exceeds this new range the bisection process is repeated. The Performance Statistics can be displayed in three different modes. These modes can be selected in the Options dialog (tab: General) from the Tools menu. Note that the Performance Display itself needs to be rendered and thus increases the R-value slightly. Just open an empty scene to see this offset.

The Prf value is distorted and not significant any more if Prevent D3D Queuing is enabled in the Advanced Direct3D settings!